nRF Thread Topology Monitor allows you to select the serial port, scan for network devices, and tweak several parameters. All these options are available from one application window, and most require displaying network topology first.
The application window of nRF Thread Topology Monitor can be divided into navigation bar and panels, which are described in the following sections.
Initially, no topology is displayed in the Topology panel. You must first discover the network as described in Connecting to a Thread topology.
Navigation bar
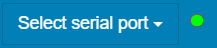
In the navigation bar at the top, you can select the serial port from a drop-down menu.

Once you select a serial port, you can scan for devices connected to it. The devices are displayed in the Topology panel, where you can select them to see their parameters.
To close the connection, click a different serial port name in the drop-down list or close nRF Thread Topology Monitor.
Discovered devices
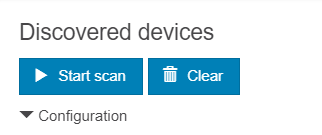
- Start scan initiates the scanning for network devices. After the Thread network topology is displayed in the Topology panel, this button changes to Stop scan, which interrupts the scanning for network devices and clears the Topology panel.
- Clear resets the scanning results.
- Configuration drop-down menu allows you to define
Thread network parameters for scanning. Because nRF devices act as
OpenThread CLI devices, you must configure several parameters before
scanning, as described in Connecting to a Thread topology. Figure 4. Configuration drop-down listThe following basic Operational Dataset parameters must be configured before scanning:
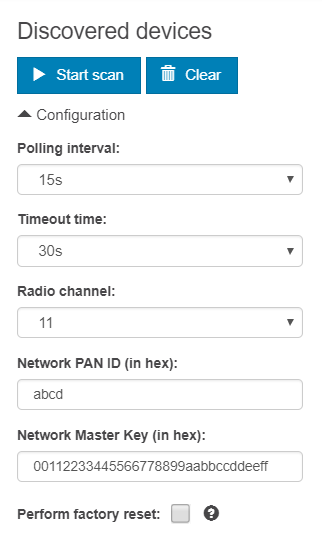
- Radio channel
- This parameter specifies the radio channel used by the Thread network. The list allows to select a value from 11 to 26 (inclusive).
- Network PAN ID (in hex)
- This parameter specifies the PAN ID of the Thread network in the hexadecimal format. For example, abcd for 0xabcd, which is also the default value.
- Network Master Key (in hex)
- This parameter specifies the master key used for authenticating a device into the Thread network. It is provided in the 32-byte format, for example 00112233445566778899aabbccddeeff, which is also the default value.
- Polling interval
- This parameter specifies how often an nRF device polls other
nodes for information about their status.Note: Keep the polling interval bigger (in seconds) than the total number of routers in the network.
- Timeout time
- This parameter specifies the maximum time span between two responses to poll requests, after which the node is removed from the network topology.
- It allows an nRF Thread device to change its Operational Dataset parameters.
- It forces a random choice of a new Extended Address during the factory reset procedure. The application will ignore any custom or previously assigned label.
Device parameters
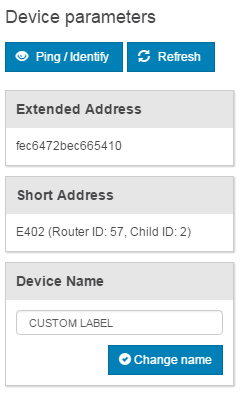
- Extended Address displays the address of the device in the hexadecimal format.
- Short Address displays the shortened address of the device, with Child and Router IDs.
- Device Name displays the custom device name.
- Ping/Identify sends a ping to the Thread device that
you select in the topology panel.Note: If the Thread device uses the Thread BSP module, LEDs on this device start blinking.
- Refresh updates information about the device before regular polling.
- Change Name allows you to modify the device name in
the application.Note: nRF Thread Topology Monitor matches Extended Address with Device Name and stores it in the persistent memory on the PC.
Log
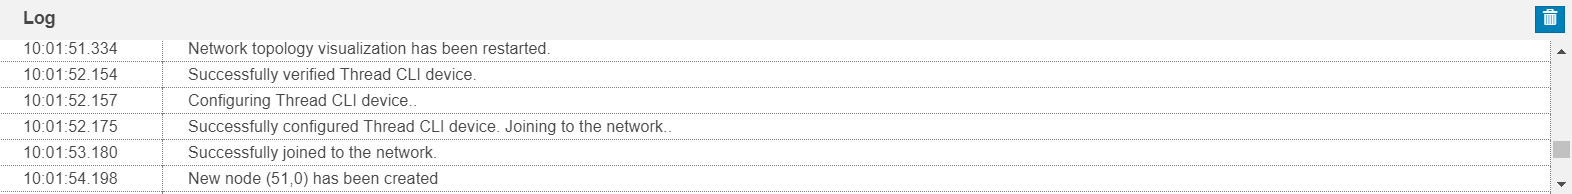
Clicking the Clear log button in the top-right corner of the panel erases all the information in the Log panel.
Topology panel
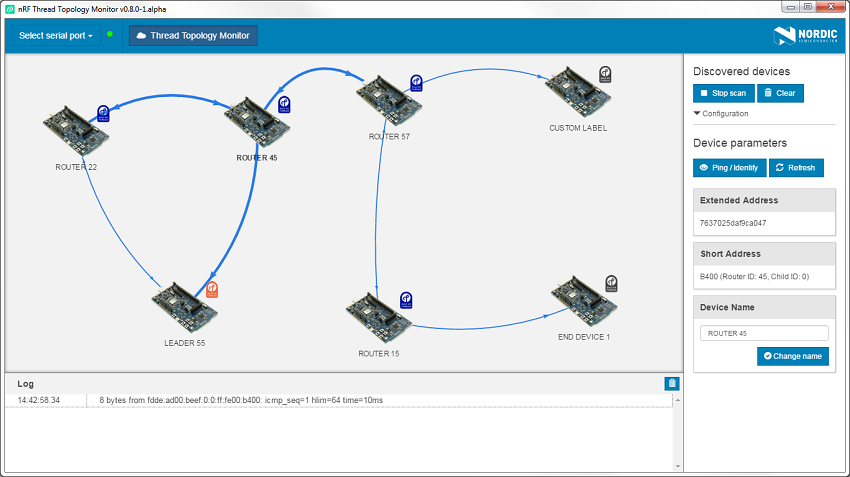
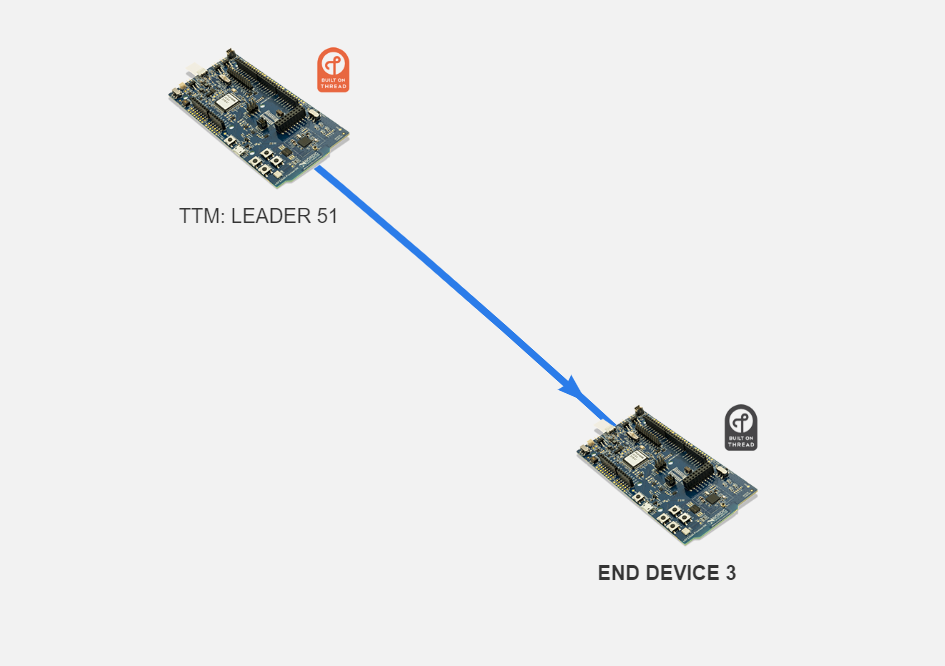
- Orange Thread icon represents the Leader device.
- Blue Thread icons represent Routers.
- Black Thread icons represent End Devices.
- Router-to-router - indicated by two arrows in opposite directions.
- Router-to-end-device - indicated by one arrow. End Devices communicate through a single router and cannot forward packets for other network nodes.
- Use the mouse scroll to zoom in and zoom out of the network topology.
- Press the left mouse button and move the mouse around to move the network topology in the same direction.
- Click a node to select it and drag it to a different location within the topology view while keeping the left mouse button pressed.
- Click a node to see its particular connections, which will appear as bolded out in the topology view upon selection.
- Click a node to see its parameters in the Device parameters panel.
- After selecting a node, modify the device name label or ping the device using options in the Device parameters panel. See Device parameters for more information.