For nRF Thread Topology Monitor to attach the nRF device to the Thread network and send OpenThread CLI commands over serial port, the nRF device must be programmed with the OpenThread CLI example that is included in the the nRF Thread Topology Monitor package as a hexadecimal file.
To set up an nRF52840 DK, nRF52833 DK, or nRF52840 Dongle, complete the following steps:
-
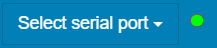
In the navigation bar, click Select serial port.
Figure 1. Navigation bar
 The list of available virtual COM ports appears, one for each connected device.
 -
Select the serial port of the device that you want nRF Thread Topology Monitor
to use.
A notification in the log will inform you about the successful opening of the connection, and the status indicator next to the button will light green.Figure 2. Serial port selection indicator
-
In the Discovered devices panel, expand the
Configuration drop-down menu and check that the
mandatory network parameters are correct.
Figure 3. Configuration drop-down listThe following parameters in nRF Thread Topology Monitor must match your Thread network parameters:
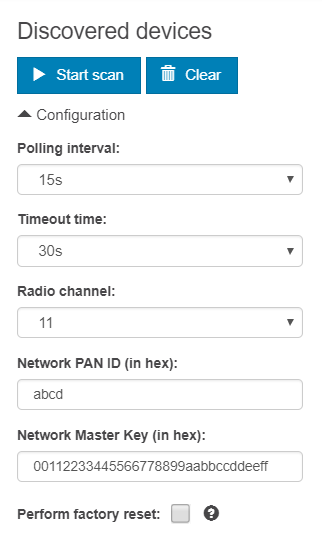
- Radio channel
- Network PAN ID (in hex)
- Network Master Key (in hex)
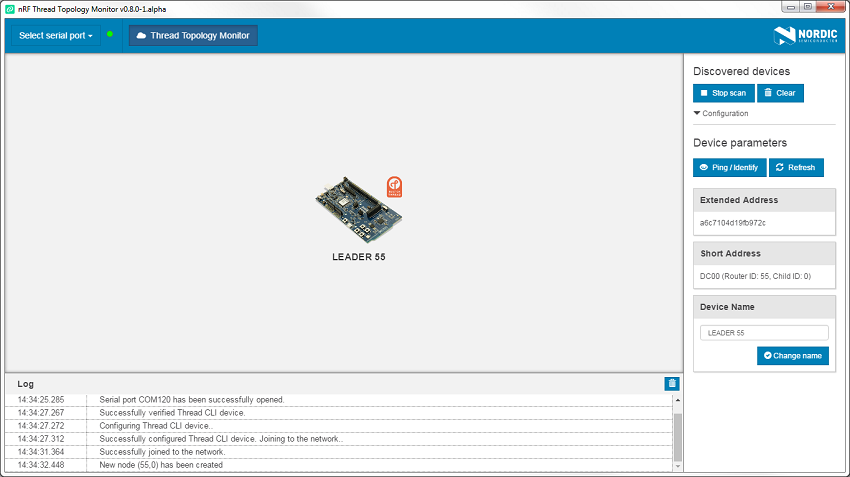
If the nRF device is the first device to join the Thread network, it becomes the
Leader, as shown in the following figure:
Figure 4. First Thread Leader is connected
At this point, other Thread devices attach themselves to the network.If there already are devices in the Thread network, the nRF device joins as an End Device, and then becomes a Router within the network.
Eventually, nRF Thread Topology Monitor displays a topology that is similar to the
following figure:
Figure 5. Topology panel with Thread nodes
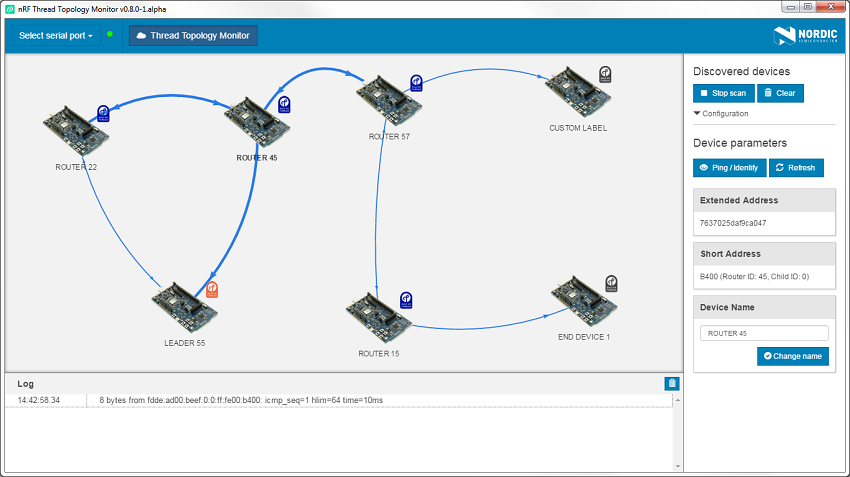
You can interact with the topology nodes in the following
ways:
- Use the mouse scroll to zoom in and zoom out of the network topology.
- Press the left mouse button and move the mouse around to move the network topology in the same direction.
- Click a node to select it and drag it to a different location within the topology view while keeping the left mouse button pressed.
- Click a node to see its particular connections, which will appear as bolded out in the topology view upon selection.
- Click a node to see its parameters in the Device parameters panel.
- After selecting a node, modify the device name label or ping the device using options in the Device parameters panel. See Device parameters for more information.