The Smart Remote firmware can be built in debug or release mode. Debug mode is recommended for development, while release mode should be used for production. Debug mode can be turned on with CONFIG_DEBUG_ENABLED. By default, it is enabled on nRF52832 and disabled on nRF52810.
The following table summarizes the differences between these modes:
| Release mode | Debug mode |
|---|---|
| Internal error detected by APP_ERROR_CHECK() causes a reset. If the logger is enabled, basic information about the error is printed. | APP_ERROR_CHECK() halts the firmware. If the logger is enabled, extensive information about the error is printed. |
| Hard fault causes a reset. | Hard fault halts the firmware. |
| Error messages contain only error code. | Error messages contain the error code, file name, and line number. |
| Assertions are excluded from compilation. | Assertions are compiled in the firmware. |
| All debug utilities are disabled. | Debug utilities are compiled in, according to the configuration under the Debug Mode tree. |
APP_ERROR_CHECK is a convenience macro for error validation.
If the logger is enabled, error information is printed out regardless of debug/release mode settings. The error information is more detailed when debug mode is enabled.
Debug mode requires a significant amount of space in flash memory. It can be disabled to provide space for other features.
Debugging infrastructure
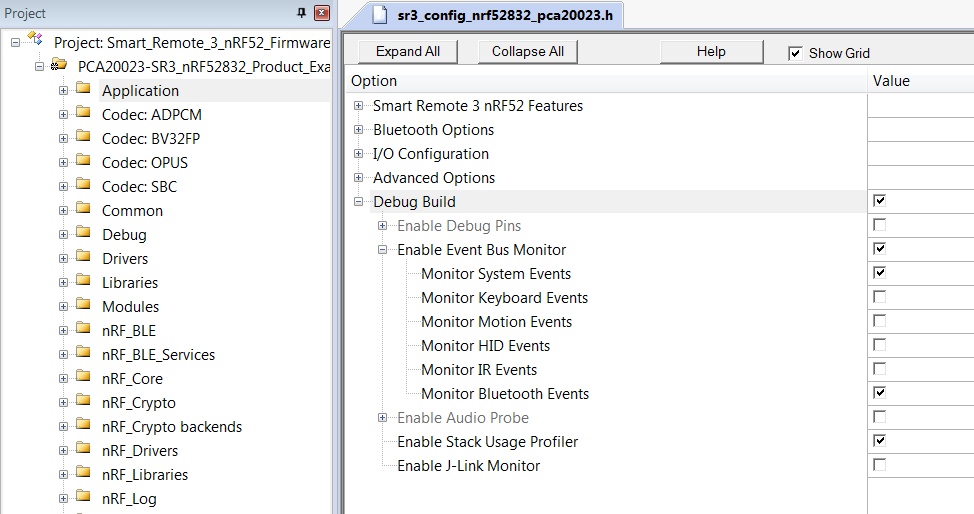
Debug mode adds an infrastructure useful for development and debugging. Features available in debug mode:
Each of the mentioned features can be enabled or disabled separately in the configuration file.
Debug pins
Some events need to stick to a specific timing or happen too fast to be effectively observed with log messages. Debug pins make it possible to observe the timing of the events on an oscilloscope or a logic analyzer.
Error handling debug pins send an error code, file name, and line number of the code where the error happened over an SPI-like transmission:
- CONFIG_IO_DBG_MARK - asserted during transmission of the error.
- CONFIG_IO_DBG_CLOCK - Serial Clock pin during error message transmission.
- CONFIG_IO_DBG_DATA - Serial Data pin during error message transmission.
Audio debug pins show the exact timing of audio processing.
- CONFIG_IO_DBG_AUDIO_CAPTURE - pulses when an audio buffer is passed from the PDM driver to audio processing.
- CONFIG_IO_DBG_AUDIO_PROCESS - set to high state during audio processing. If there is an error during audio processing, this pin stays in high state until the next audio buffer is processed.
Sleep debug pin CONFIG_IO_DBG_SLEEP - set to high state when the device goes to sleep.
IR transmitter debug pins are useful to observe the IR driver behavior.
- CONFIG_IO_DBG_IR_TX_PWM_INT - pulses in the beginning of a PWM interrupt handler driving the IR transmitter.
- CONFIG_IO_DBG_IR_TX_SACK - pulses when IR "symbol acknowledge" is signaled.
- CONFIG_IO_DBG_IR_TX_EACK - pulses when IR "end acknowledge" is signaled.
Event Bus monitor
With this option enabled, the Smart Remote firmware reports events that appear on the event bus. Event bus activity is displayed in the form of log messages.
It is possible to enable monitoring of the below event categories separately:
- system events,
- keyboard events,
- motion events,
- HID events,
- IR events,
- Bluetooth events.
Audio Probe
Refer to Audio Probe.
Stack usage profiler
Stack usage profiler makes it possible to measure how much stack space is used by the application.
On system start, the profiler fills stack space with a marker. When the device goes to sleep, it is checked up to which point the markers were overwritten and the maximal stack usage is reported as a log message.
J-Link Monitor mode
Using the J-Link Monitor mode allows the CPU to service time-critical tasks when the application is halted on a breakpoint. As a result, the wireless BLE link can be maintained by the SoftDevice during a debugging session.
- Note
- The J-Link driver requires a J-Link PLUS, ULTRA+, or PRO license to work in Monitor Mode. The nRF52 DK comes with built-in J-Link OB, which is lacking this feature. On Windows, the J-Link driver lets you evaluate the Monitor Mode with the nRF52 DK, while on Linux it is not possible.
To be able to debug in Monitor Mode, enable CONFIG_JLINK_MONITOR_ENABLED and compile the firmware.
- Note
- When using Keil, remember to Rebuild all target files to make sure the Monitor Mode will be enabled.
Next, flash the firmware and start a debugging session.
To turn on Monitor Mode, open the J-Link control panel (on Windows, it can be found in the taskbar tray). After expanding the control panel downwards, it is possible to type commands.
Run the following commands:
The second command instructs the debugger where the application interrupt vector table resides in ROM memory. This depends on the SoftDevice version which is used. The table below illustrates the application interrupt vector table address for different Smart Remote 3 targets.
| Target processor | nRF52832 | nRF52810 |
|---|---|---|
| SoftDevice version | S132 v5.1 | S112 v1.0 |
| Application interrupt vector table | 0x23000 | 0x18000 |
When you start debugging (run/step the application), J-Link lets you evaluate the Monitor Mode - click Yes in the pop-up window.
Now, it is possible to halt the application on breakpoints and step through the code without breaking the BLE connection.
- Note
- In Monitor Mode, the SoftDevice can respond to connected devices, but the halted application has no way of responding to BLE events from the SoftDevice. This means that actions which require servicing by the application, such as bonding, may not be handled on time and will trigger a SoftDevice assertion. Assertion will also happen if the SoftDevice event queue overflows.
Logging on RTT in Monitor Mode
If you try to read RTT log messages in J-Link Monitor Mode, you will notice that they do not appear. This happens because the firmware starts logging on RTT only if the CoreDebug->DHCSR register indicates that there is a debugger connected. In Monitor Mode, the CoreDebug->DHCSR register is not set by debugger.
To use RTT logging during a Monitor Mode debug session, you can modify the condition
to
in 3 places in the firmware: main.c, nrf_cli_rtt.c, and app_error_handler.c.
Remember to revert these changes after you are finished working in Monitor Mode.
- Note
- An alternative to RTT is to use logging over UART. For UART, no changes are needed in Monitor Mode.