Table of Contents
nRF Thread Topology Monitor is a desktop application that helps to visualize the current network topology. The application requires a serial connection to an nRF52 Development Kit with Nordic’s Thread solution.
Supported devices:
- nRF52840 Development Kit (PCA10056)
- nRF52840 Dongle (PCA10059)
- nRF52833 Development Kit (PCA10100)
Supported operating systems:
- Windows (tested on Windows 10)
- Ubuntu Linux (tested on Ubuntu 18.04)
Installation requirements
Make sure you meet the following requirements before you start the Installation.
Installation requirements on Windows
On Windows, you must install nRF Command Line Tools, which include the SEGGER J-Link software. See nRF5x Command Line Tools.
Installation requirements on Linux
On Linux, you must install:
- SEGGER J-Link software – download and install the software from SEGGER J-Link or from your distrubution package manager.
- libgconf library – install the missing dependency using your package manager. For example, on Ubuntu, type: sudo apt-get install libgconf-2-4
Additionally, make sure that you have the permissions to access the following elements on Linux:
- /dev/ttyACM0 serial port – add the current user to a proper group and log out to refresh the user credentials. The group name is distibution-dependent and in order to read it, run the following command: For example, on Ubuntu, the group name is dialout:ls -l /dev/ttyACM0sudo adduser USERNAME dialout
- storage files that keep information like the last configuration and node names – run the following command: This will help avoid permission-related errors that might appear when nRF_TTM was run with sudo permissions for the first time, and later the application was run without them.sudo chown -hR USERNAME /home/USERNAME/.config/nRF_TTM/
Installation
Follow these steps to install nRF Thread Topology Monitor:
- Navigate to nRF Thread Topology Monitor web page and download one of the following packages:
- Windows:
nRF_TTM-win32-x64_v0.12.0-1.alpha - Linux:
nRF_TTM-linux-x64_v0.12.0-1.alpha.tar.gz
- Windows:
- Extract the package.
- Run the nRF Thread Topology Monitor executable file.
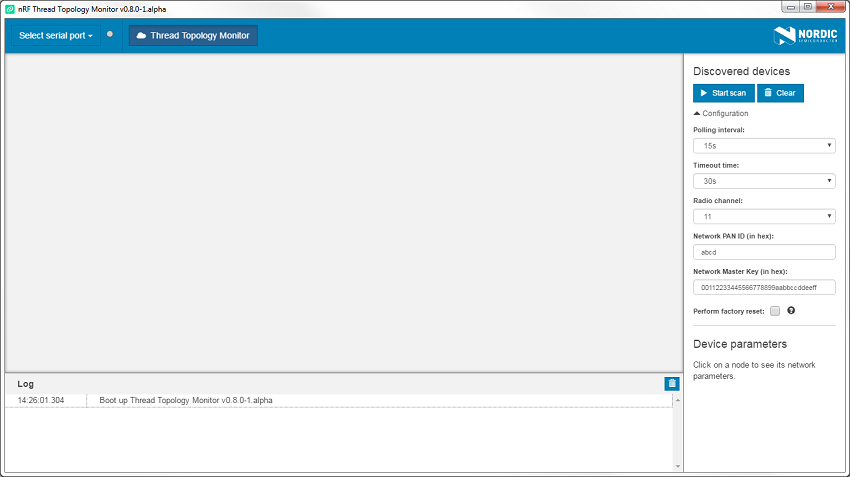
After starting nRF Thread Topology Monitor, the main window of the application appears. It consists of the following elements:
- Center area – initially empty, but will be later populated with visual representations of Thread nodes.
- Navigation bar at the top – lets you select a serial port.
- Discovered Devices pane on the right – contains options that let you scan the network or to clear the current topology view.
- Log area at the bottom – displays the most important log events, tagged with a timestamp.
Viewing network topology
nRF Thread Topology Monitor requires a serial port connection to a local nRF52 Development Kit or an nRF52840 Dongle. The nRF SoC on the development kit is controlled by the nRF Thread Topology Monitor that sends OpenThread CLI commands to it over serial port. Therefore, it must be programmed using the OpenThread CLI example.
- Note
- nRF Thread Topology Monitor filters serial ports to show only those with J-Link or OpenThread USB PIDs. If you use a custom board or firmware that are based on OpenThread CLI, click the Show all button in the dropdown menu when selecting the serial port.
Complete the following steps to set up an nRF52 Development Kit or an nRF52840 Dongle:
- Connect the development kit or dongle to the computer through the J-Link USB.
- Use nrfjprog (from nRF5x Command Line Tools) to flash the nRF SoC with the OpenThread CLI example. Depending on the board you are using:
- nRF52840 Development Kit (PCA10056): nrfjprog -f NRF52 --program <InstallFolder>/examples/thread/cli/ftd/uart/hex/nrf52840_xxaa_pca10056.hex --chiperase --reset
- nRF52840 Dongle (PCA10059): use the hex file located at
<InstallFolder>/examples/thread/cli/ftd/usb/hex/nrf52840_xxaa_mbr_pca10059.hex. See nRF52840 Dongle for detailed information about how to program PCA10059. - nRF52833 Development Kit (PCA10100): nrfjprog -f NRF52 --program <InstallFolder>/examples/thread/cli/ftd/uart/hex/nrf52833_xxaa_pca10100.hex --chiperase --reset
- nRF52840 Development Kit (PCA10056):
- In the navigation bar, click Select serial port.
- Select the serial port with the device that you want to use. The menu will show the name of the selected port.
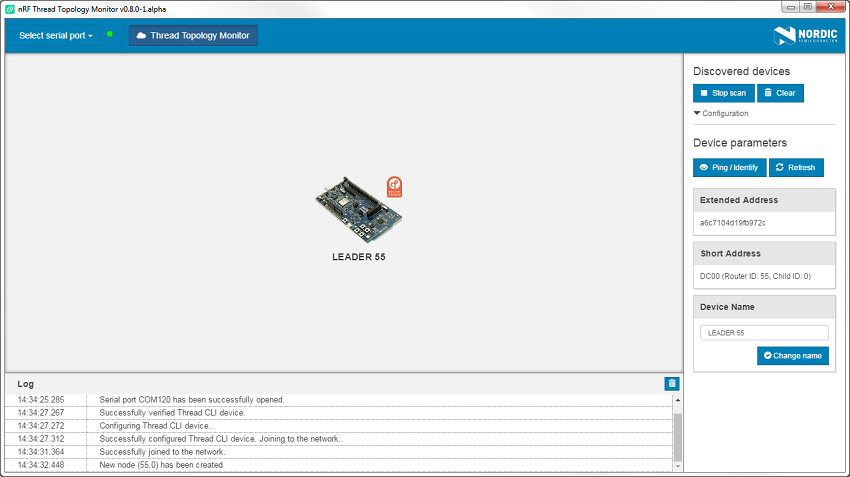
- Click Start scan to attach the nRF SoC to the Thread network and to start polling nodes to get information on the current topology. nRF Thread Topology Monitor starts to communicate with a node using OpenThread serial CLI. After a couple of seconds, topology of the Thread network appears in the central area of the application.
If the nRF SoC is the first Thread device in the network, it becomes a Leader, as shown in the figure below.
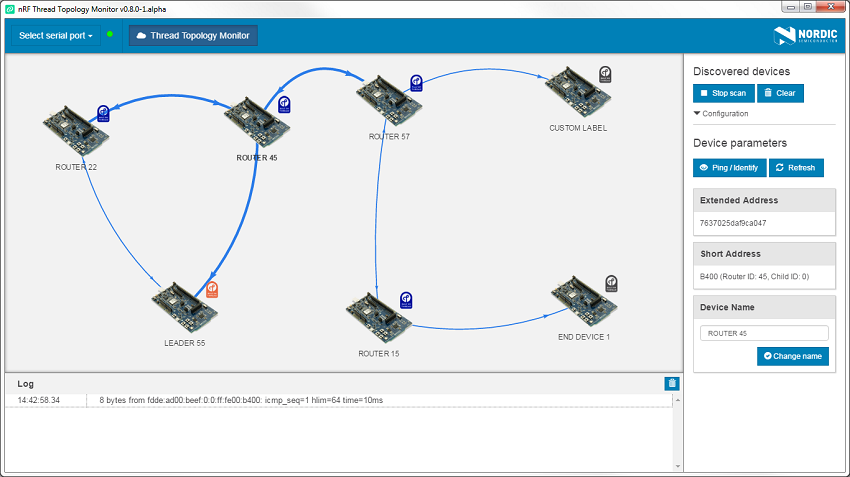
After other Thread devices have been attached to the network, nRF Thread Topology Monitor visualizes them as shown in the figure below.
You can:
- Click a Thread device to show its parameters.
- Use the mouse scroll to zoom in and zoom out of the network topology.
Configuration
The panel to the right of the main application window contains the Configuration section. Because nRF SoC acts as an OpenThread CLI device, you must configure the basic Operational Dataset. During this configuration, you can specify the following parameters of the Thread Network:
- Radio channel (11-26)
- Network PAN ID (for example, abcd for 0xabcd)
- Network Master Key (for example, 00112233445566778899aabbccddeeff)
- Select the Perform factory reset option to use a factory reset before the attachment process or to use normal reset otherwise.
- Selecting this option:
- Allows the nRF Thread device to change its Operational Dataset parameters after the factory reset: Radio Channel, PAN ID, and Master Key.
- Forces a random choice of a new Extended Address during the factory reset procedure. The application will ignore any custom or previously assigned label.
- Selecting this option:
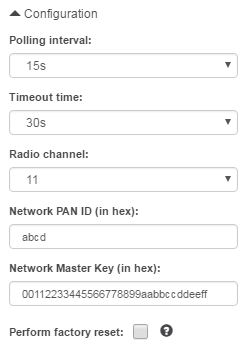
Apart from Thread network configuration, you can also specify two parameters related to polling:
- Polling interval specifies how often the nRF SoC polls other nodes for information about their status. It is recommended to keep the polling interval bigger (in seconds) than the total number of routers in the network.
- Timeout time specifies the maximum time span between two responses to poll requests, after which the node is removed from the network topology.
- Note
- After you restart the application with the Perform factory reset option, the topology will disappear and reappear after up to two minutes. This is because an nRF Thread device connected to the Thread Topology Monitor has to become a Thread Router to obtain all routing information. In Thread protocol, only the Leader of the network can allow a Child to become a Thread Router. If the Leader has been restarted and some other Thread Routers exist in the network, they need to time out the previous Leader and elect a new one.
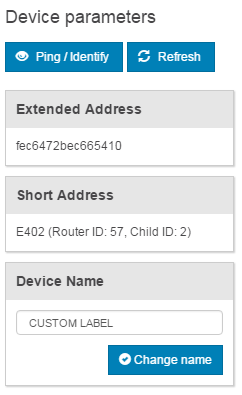
Interacting with nodes
nRF Thread Topology Monitor allows to select a specific node in a Thread network and perform operations on it:
- Read its Extended and Short Addresses.
- Click Ping / Identify to ping the Thread device. If the Thread device uses the Thread BSP module, as do all examples in the
threaddirectory of this SDK, LEDs on this device will start blinking. - Click Refresh to refresh information about the device before regular polling.
- Change the device name. Note that nRF Thread Topology Monitor matches Extended Address with Device Name and stores it in persistent memory on the PC side.
Principle of operation
The background process of nRF Thread Topology Monitor communicates with nRF SoC using OpenThread CLI, sending commands described in OpenThread CLI Reference.
The application first attaches the nRF SoC to the network and then periodically retrieves the current list of routers. Each router is polled by sending the standard Thread diagnostic messages (MGMT_DIAG.req). In response, routers in the network send their current link set (current connected neighbors), child table, and basic network parameters, such as Network Address or Extended MAC Address.