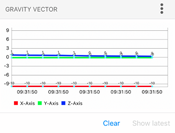
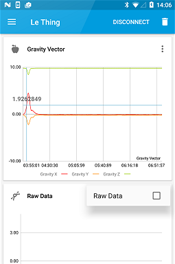
The Gravity vector section displays the effect of gravity on each axis in units of m/s2.
To use this feature, tap the Action/More options icon ![]() and use the toggle to enable it. The live graph will start displaying data. You can
move Thingy around to see how gravity affects it.
and use the toggle to enable it. The live graph will start displaying data. You can
move Thingy around to see how gravity affects it.
| iOS | Android |
 |
 |
You can interact with the graph in the following way:
- The graph will autoscroll when you first open it.
- Tap a point on the graph to view its value.
- Tap and hold to stop the graph from autoscrolling. You can now manually scroll the graph back and forth.
For iOS, the following also applies:
- When there are new values available, the Show latest button will be
enabled.
- Tap the button to scroll the graph to the last entry. This will also reenable autoscrolling.
- Tap Clear to clear all entry points and reenable autoscrolling.