Live graphs are available for the temperature and pressure features for iOS, Android and Web, and they represent the current and historical temperature measurements. For iOS and Android, live graphs are also available for humidity features. Once enabled, data will start populating the graphs in realtime.
Here are some tips when interacting with a live graph.
- iOS and Android:
-
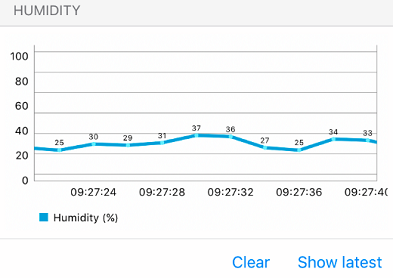
- Graphs automatically scroll to the latest value. (iOS: With Show latest button disabled)
- Tap any part of the graph to see the timestamp and exact value of the entry.
- You can scroll through the graph manually, as with any other scrollable view.
- iOS only:
-
- Tap and hold the graph to stop scrolling. The Show latest button will now be enabled.
- To resume autoscrolling, tap Show latest.
- To clear a graph, tap Clear. This will empty all data and will reenable autoscrolling.